This week's topics covered an introduction to analysis of variance (ANOVA) and calculating post-tests for measuring effect.
Question # 1 : A researcher is interested in the effects of drug against stress reaction. She gives a reaction time test to three different groups of subjects: one group that is under a great deal of stress, one group under a moderate amount of stress, and a third group that is under almost no stress. The subjects of the study were instructed to take the drug test during their next stress episode and to report their stress on a scale of 1 to 10 (10 being most pain). Report on drug and stress level by using R and the command line "migraine". Provide a full summary report on the result of ANOVA testing and what does it mean. More specifically, report using the following R functions: Df, Sum, Sq Mean, Sq, F value, Pr(>F)
  Null hypothesis
  H0: The introduction of the drug has no effect on
      the mean of the participant reaction time
      between groups.

  Alternative hypothesis
  H1: The introduction of the drug has an observable
      effect on the mean of the reaction time
      between groups.

  #Input provided data
  > highstress <- c(10,9,8,9,10,8)
  > medstress <- c(8,10,6,7,8,8)
  > lowstress <- c(4,6,6,4,2,2)
  > pain <- c(highstress,medstress,lowstress)
  > drug <- c(rep("Category 1",6), rep("Category 2",6),
            rep("Category 3",6))
  > migraine <- data.frame(pain,drug)

  #Display source data
  > migraine
     pain       drug
  1    10 Category 1
  2     9 Category 1
  3     8 Category 1
  4     9 Category 1
  5    10 Category 1
  6     8 Category 1
  7     8 Category 2
  8    10 Category 2
  9     6 Category 2
  10    7 Category 2
  11    8 Category 2
  12    8 Category 2
  13    4 Category 3
  14    6 Category 3
  15    6 Category 3
  16    4 Category 3
  17    2 Category 3
  18    2 Category 3

  #Run analysis of variance
  > results <- aov(pain~drug, data=migraine)
  > summary(results)
              Df Sum Sq Mean Sq F value   Pr(>F)
  drug         2  82.11   41.06   21.36 4.08e-05 ***
  Residuals   15  28.83    1.92
  ---
  Signif. codes:  0 ‘***’ 0.001 ‘**’ 0.01 ‘*’ 0.05 ‘.’
                  0.1 ‘ ’ 1

  #Visualize source data
  > plot(pain~drug, data=migraine)
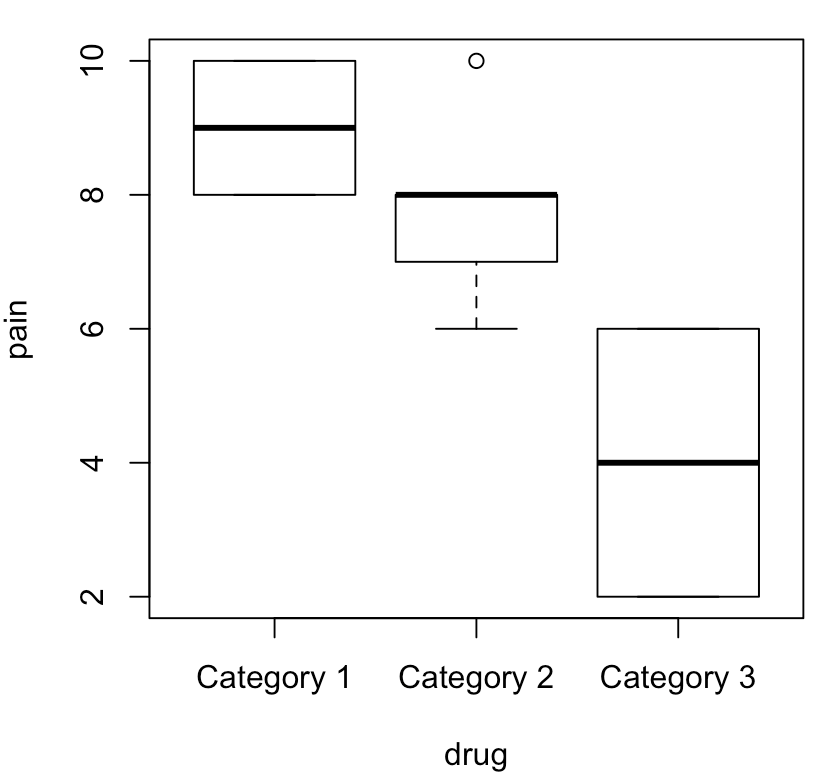
  #Conclusions from visualization and ANOVA results
  The difference in reaction times between the 3 groups
  is significant for each of the categories. With a Pr(>F)
  value of 4.08 x 10^-5 and F value of 21.36, the high
  variance in the data set is also statistically supported
  as significant.

  #Result
  Because the introduction of the drug has an observable
  effect on reaction time, we can reject the null hypothesis